Real Estate Stats

What's going on in your neighborhood?

Keeping you up-to-date on current market values is just one way we keep you informed about your biggest and most important investment - your home. Below are links to PDF copies of the market activity in 7 different zip codes in Howard County for the 1st quarter of 2012.

Don't have time to go through the whole report? Click on any of the links and read the short summary of statistics for each zip code.

21042

 21043

21044

21045

21046

20759

21029


Don't see your zip code? Send us an email with your zip code - we'd be more than happy to provide you with a Property Market Update!

February Stats Blog - Average Days on Market

If you keep up with us on Facebook, you know that this week is Stats Week! Each day we post the statistics for different counties in the state of Maryland. Seeing as this is not our Facebook page, we thought we'd share some interesting stats for Howard County for 2011.

Here are the average days on market in Howard County for the past five years. For all five years, properties that were listed during the spring market tended to sell faster than properties listed during other times of the year.  Notice how the trend is similar for each of the past five years.

HOCO_AVG_DOM

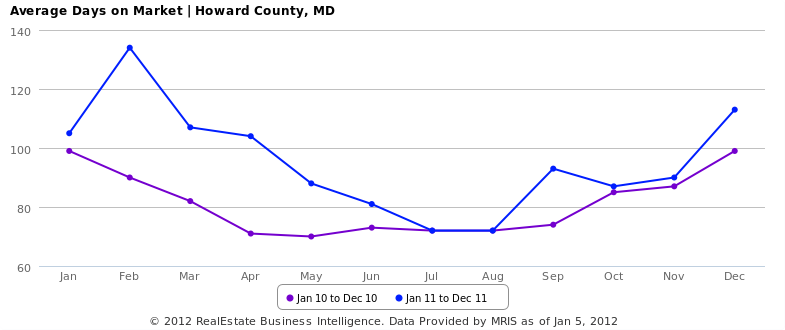
A little too confusing? Here's the average days on market for properties that have sold in Howard County for the past 2 years:

HOCO_AVG_DOM_2YRHISTORY

So, you'll notice that properties that sold in January were on the market for around 100 days - meaning that they were listed around the month of October. Properties that sold in July were on the market for about 70 days, so they were listed around May.

What’s the point you ask?

We wanted to show you facts to support what most people already know: selling your home during the Spring market will likely result in a faster sale.